Journey Mapping & Measurement for SaaS Systems
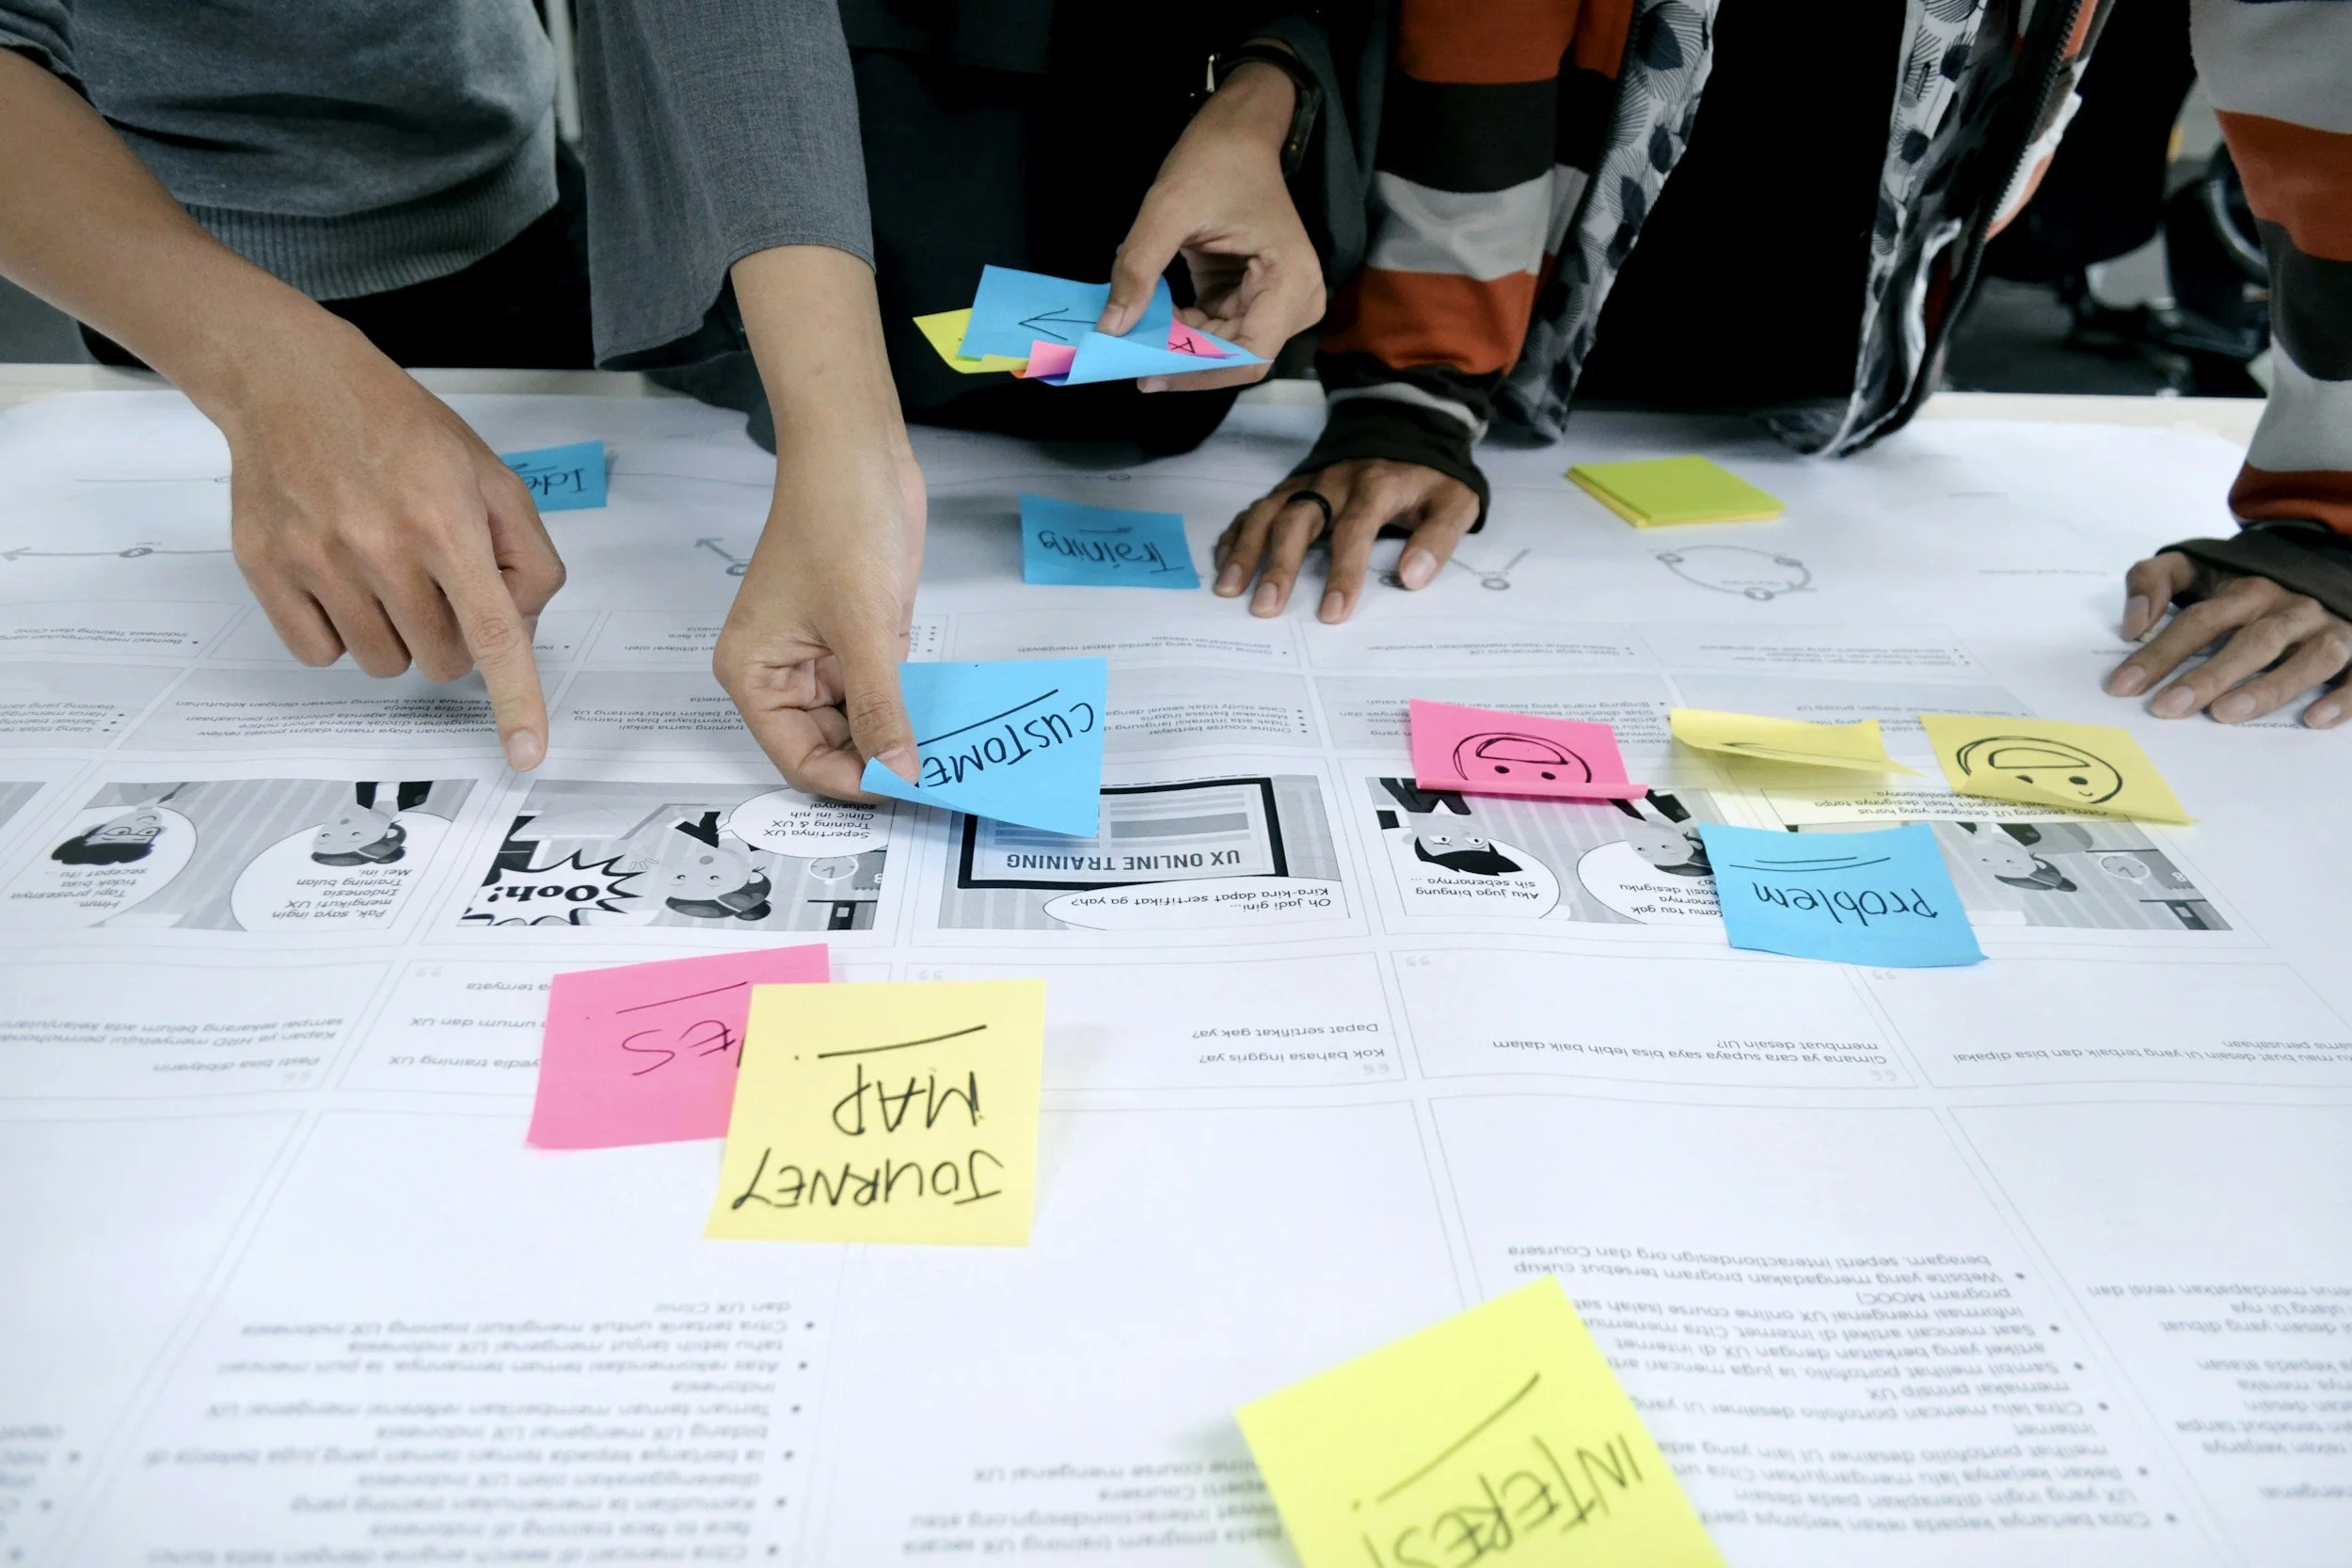
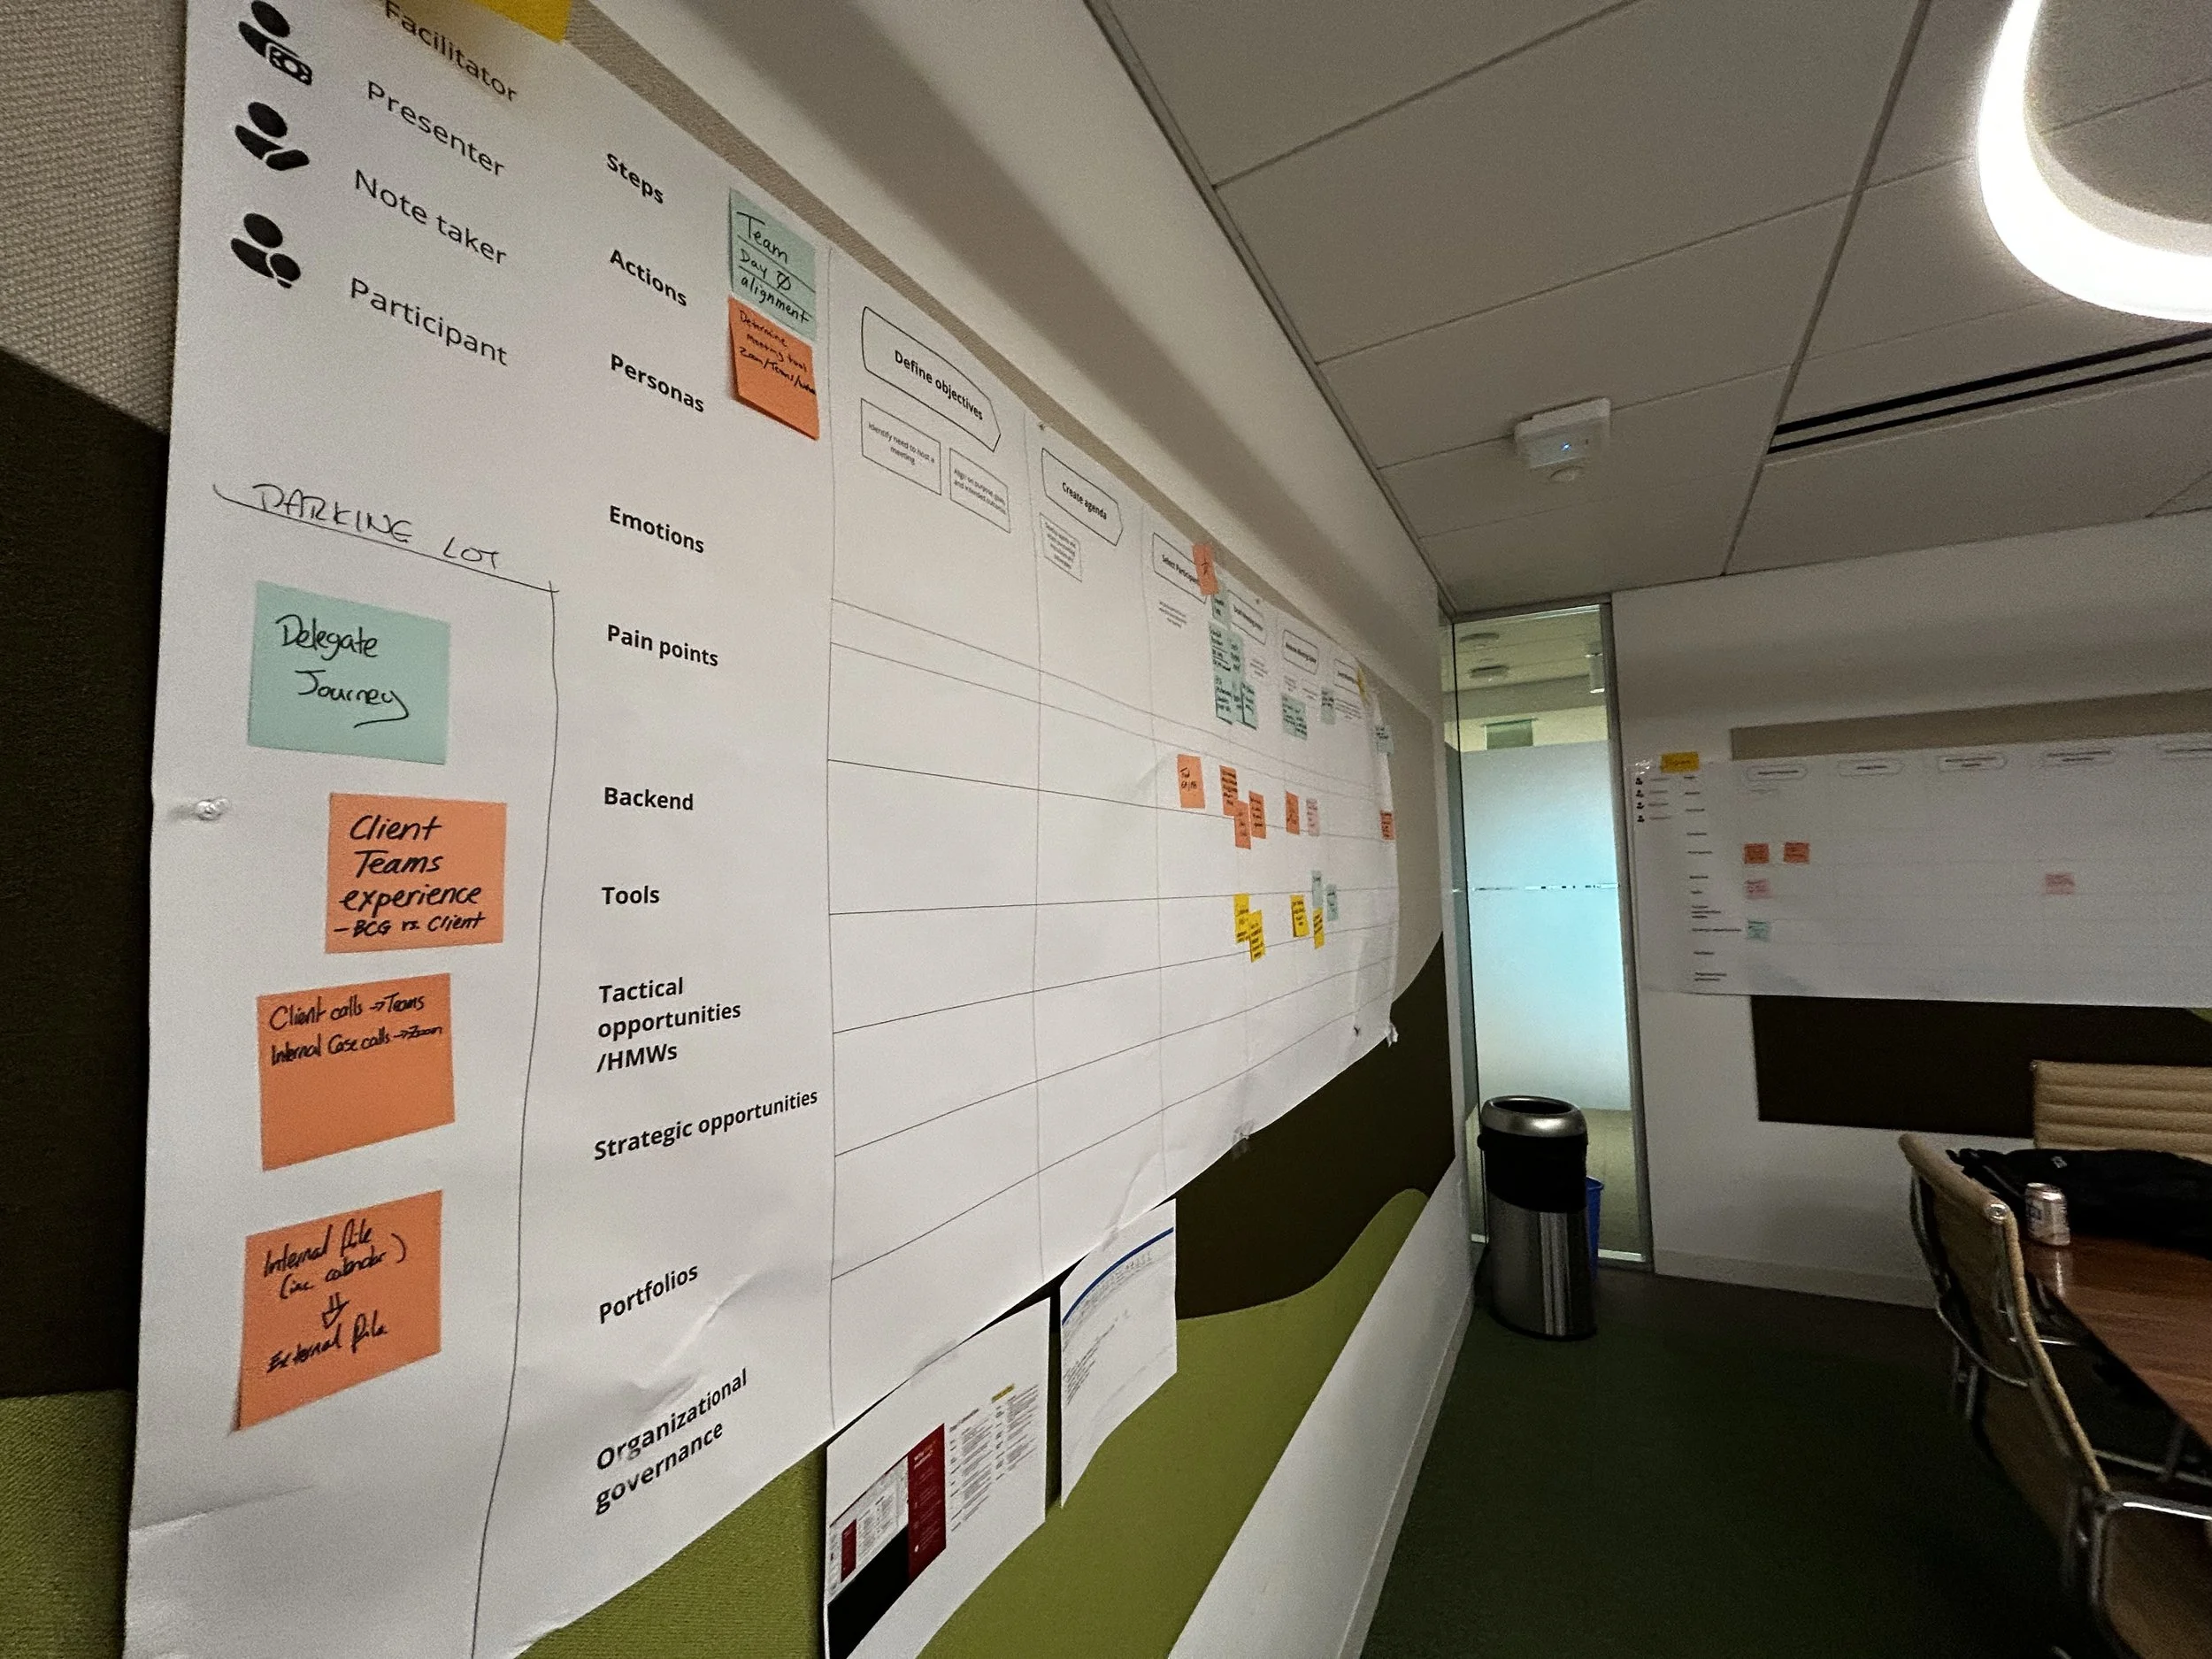
I collaborated with service designers, internal product leaders, and employees to co-create end-to-end journey maps that captured the current BCG workplace experience across products and services—pain points, delights, and opportunities included. Using participatory design, we helped surface the friction points between laptop hardware and SaaS apps—think of it as couples therapy for product teams. By bringing everyone to the table, we made it easier for teams to understand how their tools impact one another, align on priorities, and co-create a more seamless, integrated future.
My Role
Co-strategist
Lead User Researcher Workshop Facilitator
The Team
2-3 Service Designers
UX Researcher
Timeline
Tactical Research + Stakeholder Buy-in
1st Journey (pilot)
Deploy 3 Journey projects
Spring 2024
Summer 2024
Fall’24 - Winter’25
The Problem
Current State
Currently measure employee experience health in product silos
Data captured 3 x year (lagging indicators) UX is reactive in troubleshooting
Journey-Centered Solution
Future State
Broaden product health lens to look at the larger journey
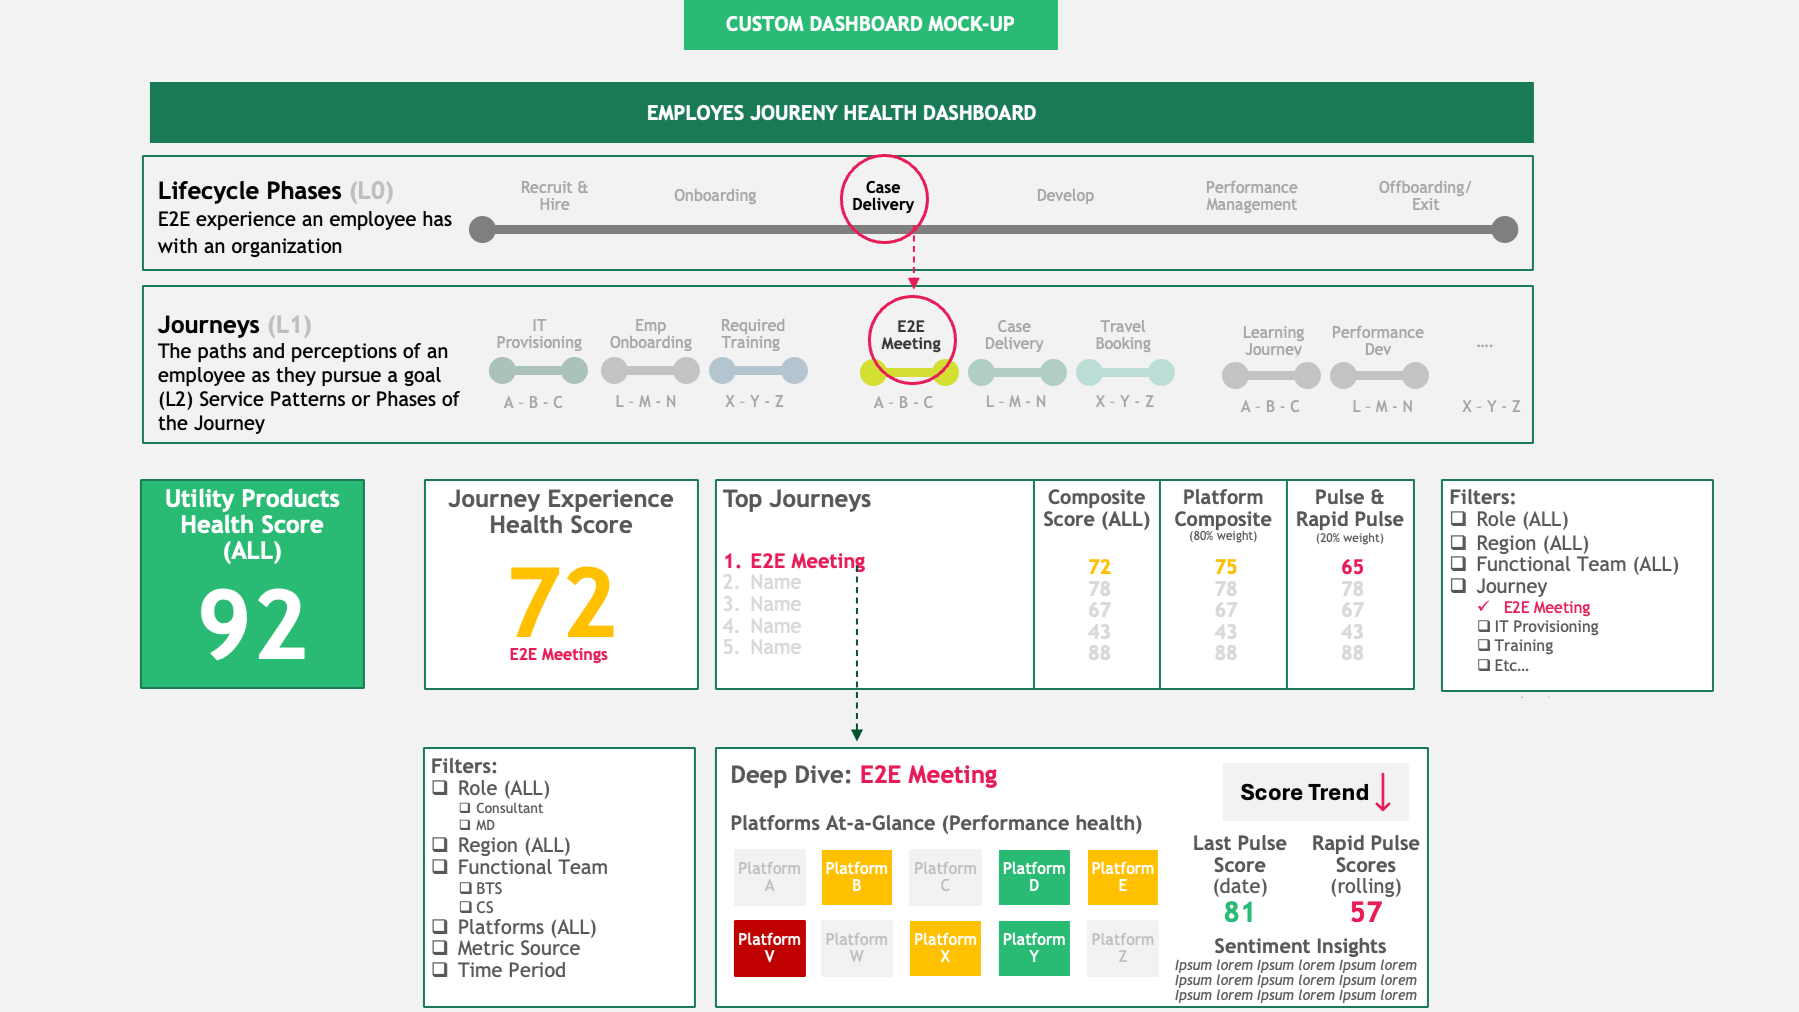
Set up and capture real-time health scores Recognize issues faster
Our Objective
Set up a framework (and execute) that consolidates existing user data metrics with corresponding user journey’s to mobilize our product leaders to make more user-centered decisions and road maps.
What we learned
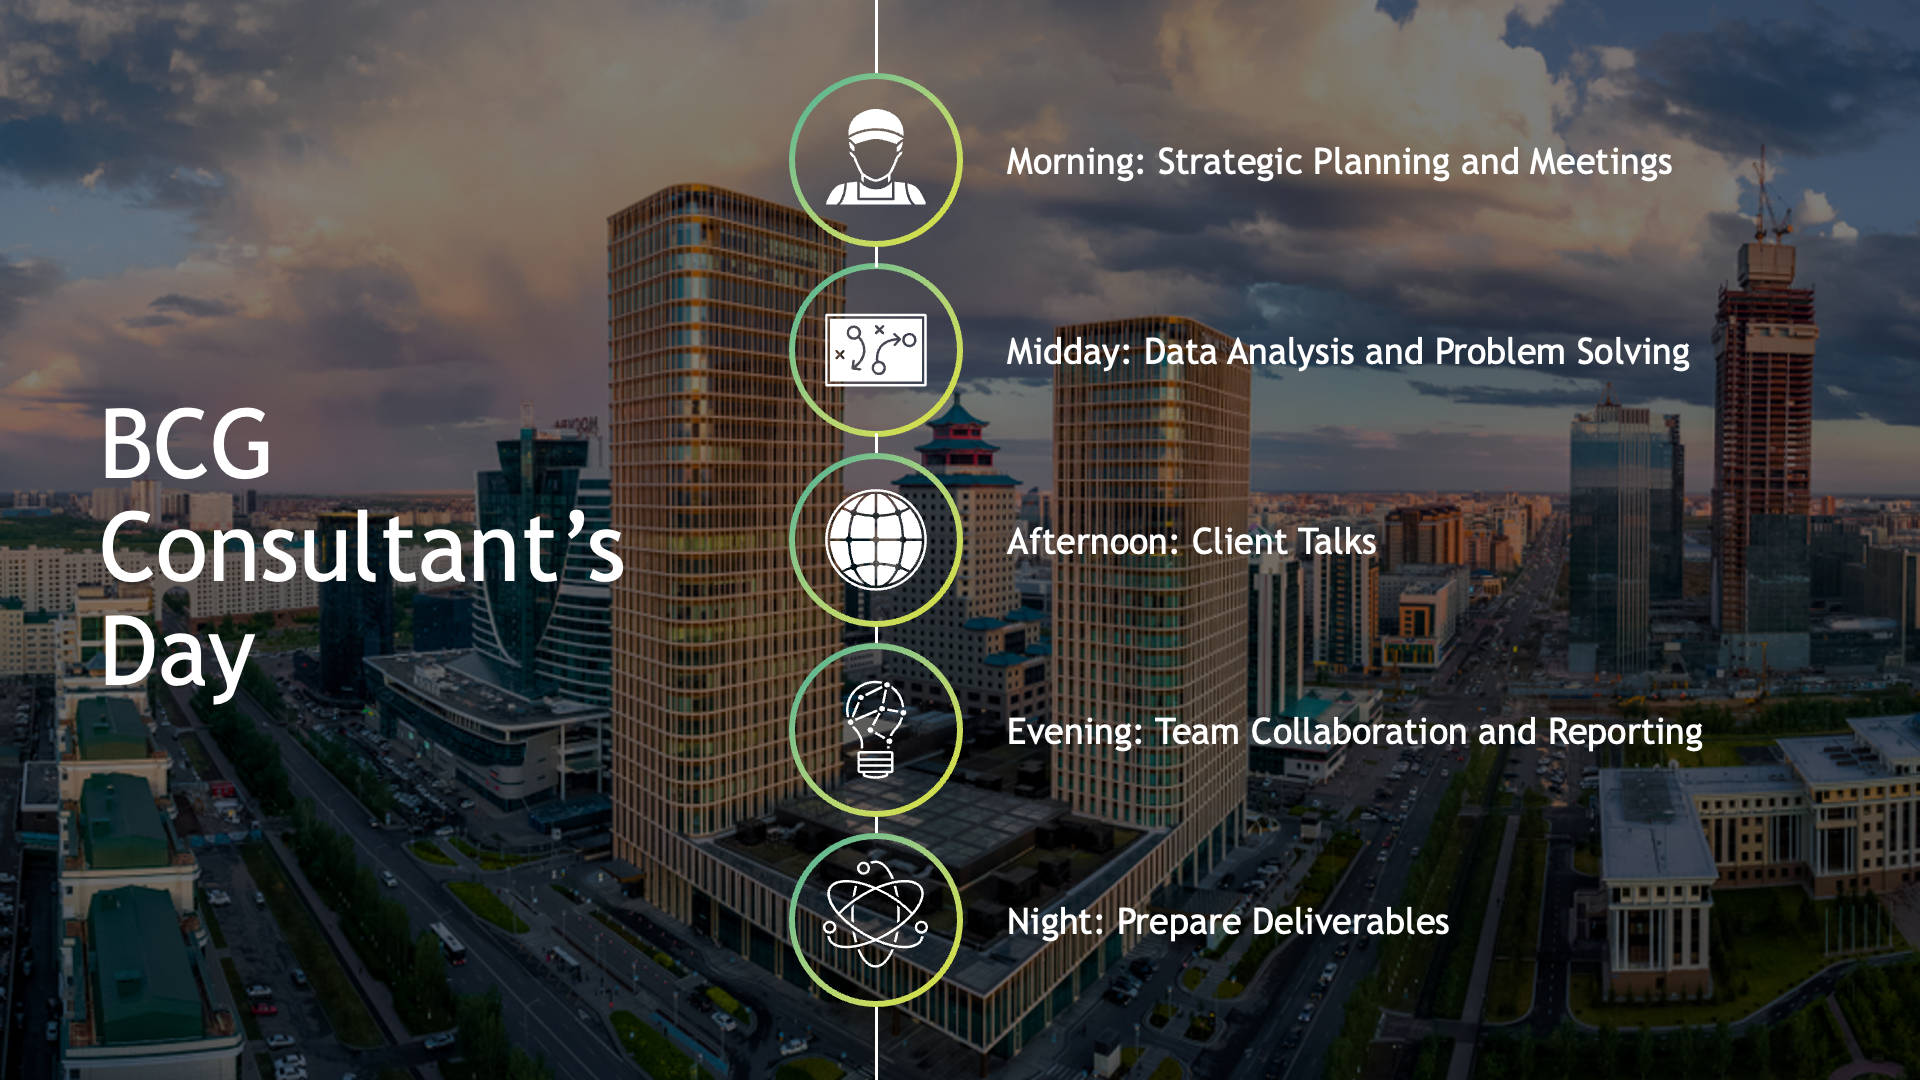
1. Spend time with BCG employees to understand their lived work-experiences
We facilitated co-creation workshops with BCG consultants, product team leaders, and UX specialists—leveraging prior qualitative research to illustrate a day in the life of a BCG consultant.
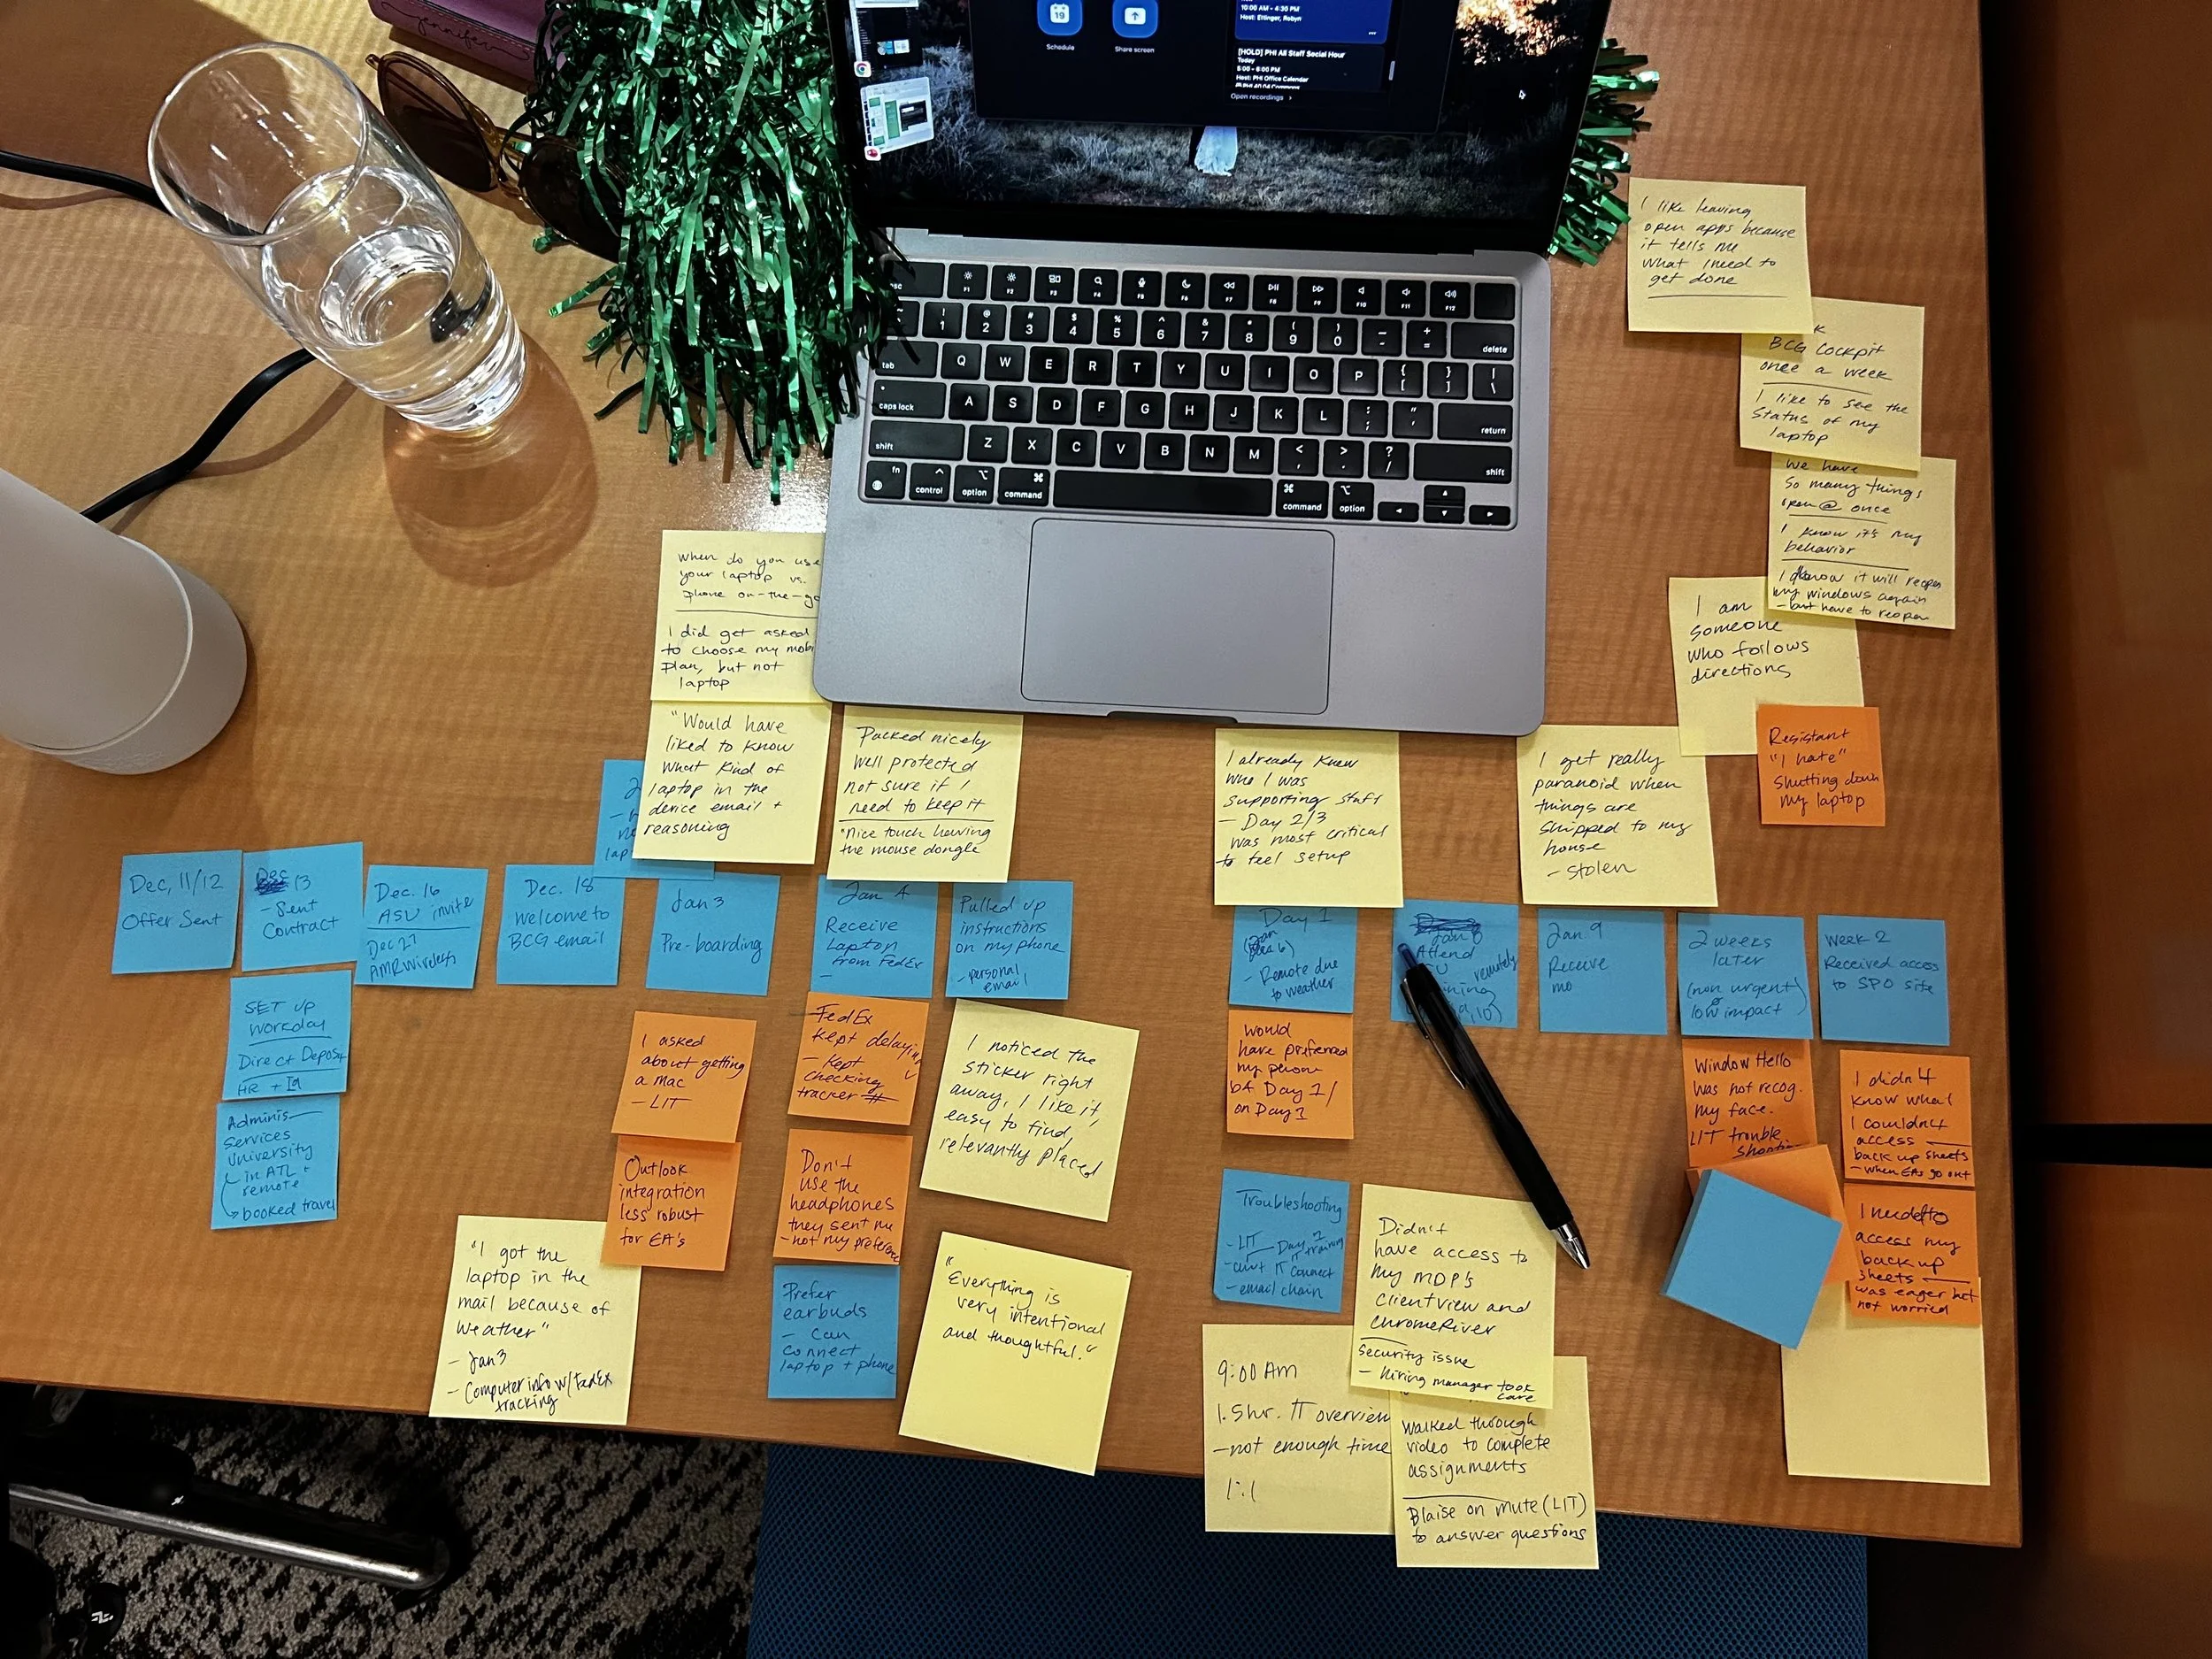
2. Map the end-to-end experience, front-end (Consultants) and back-end (BCG IT, product teams)
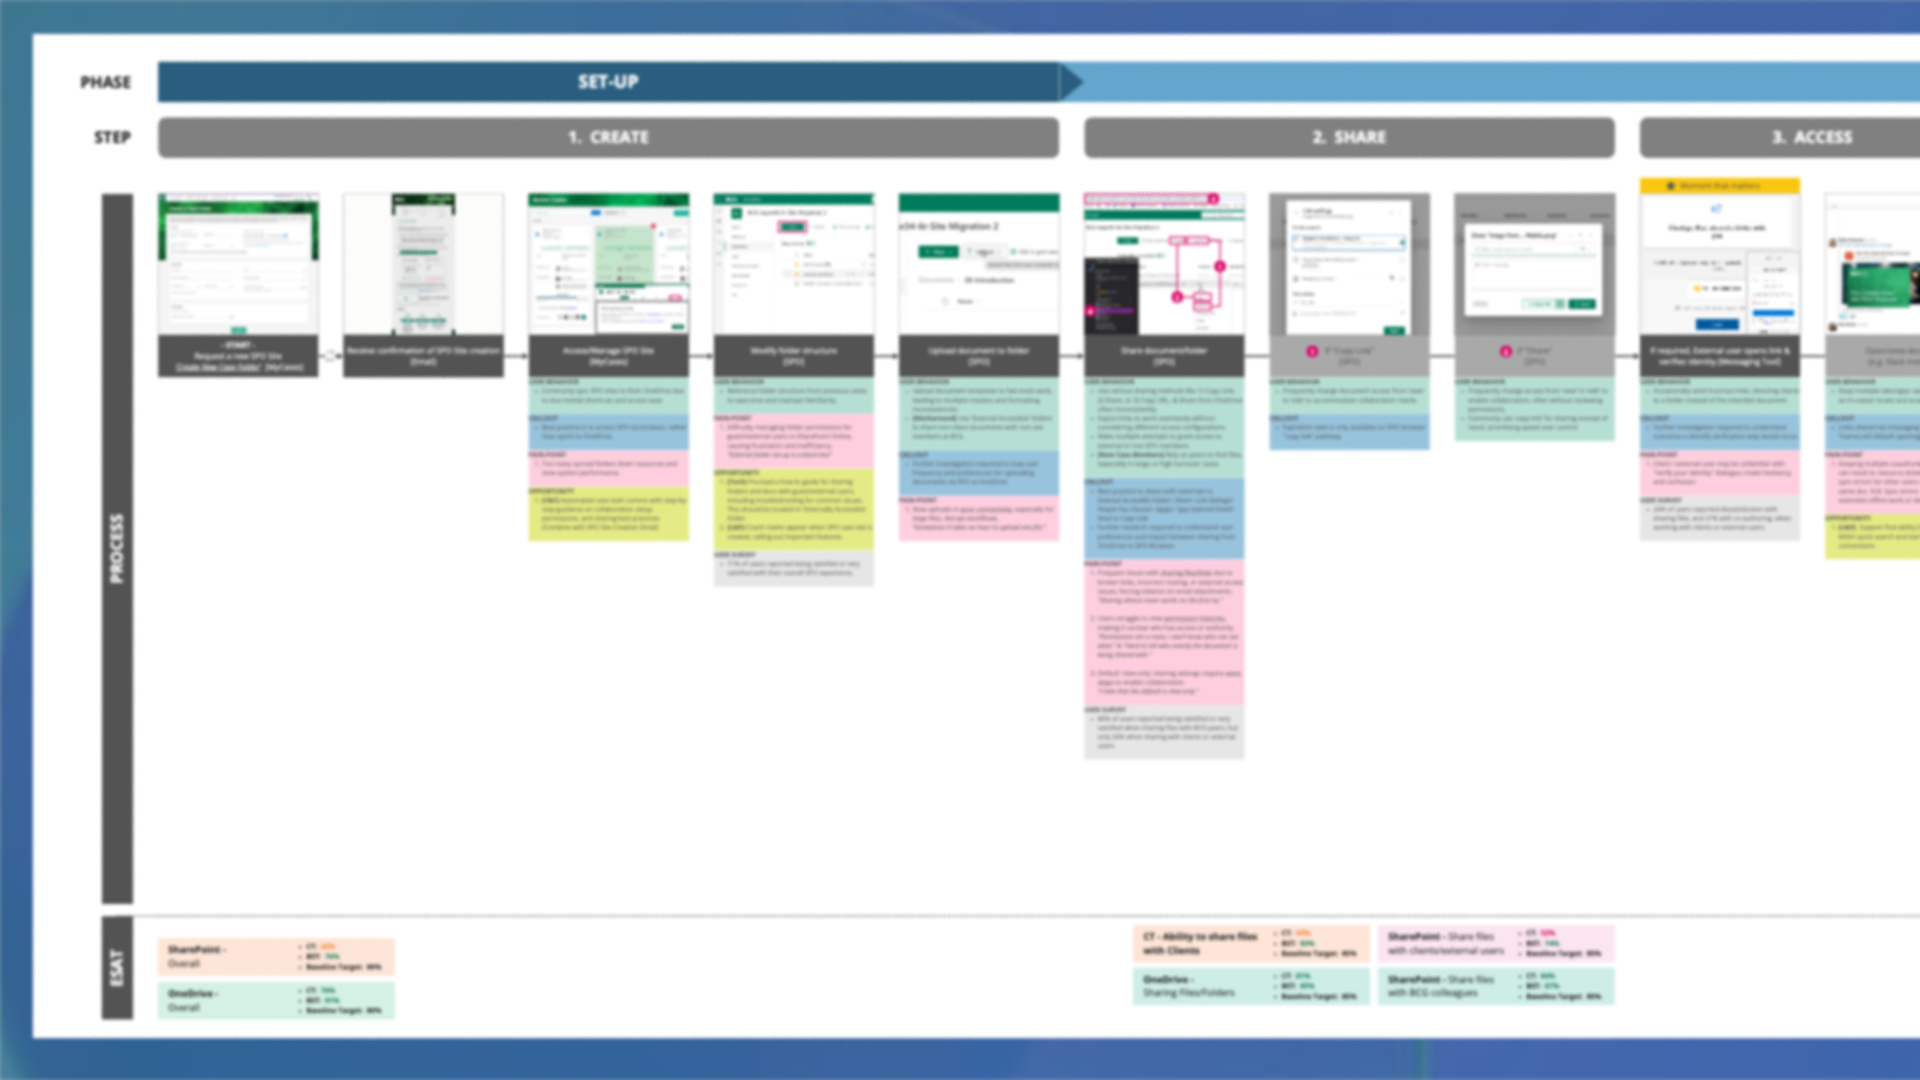
3. Less is more – Keep it high-level
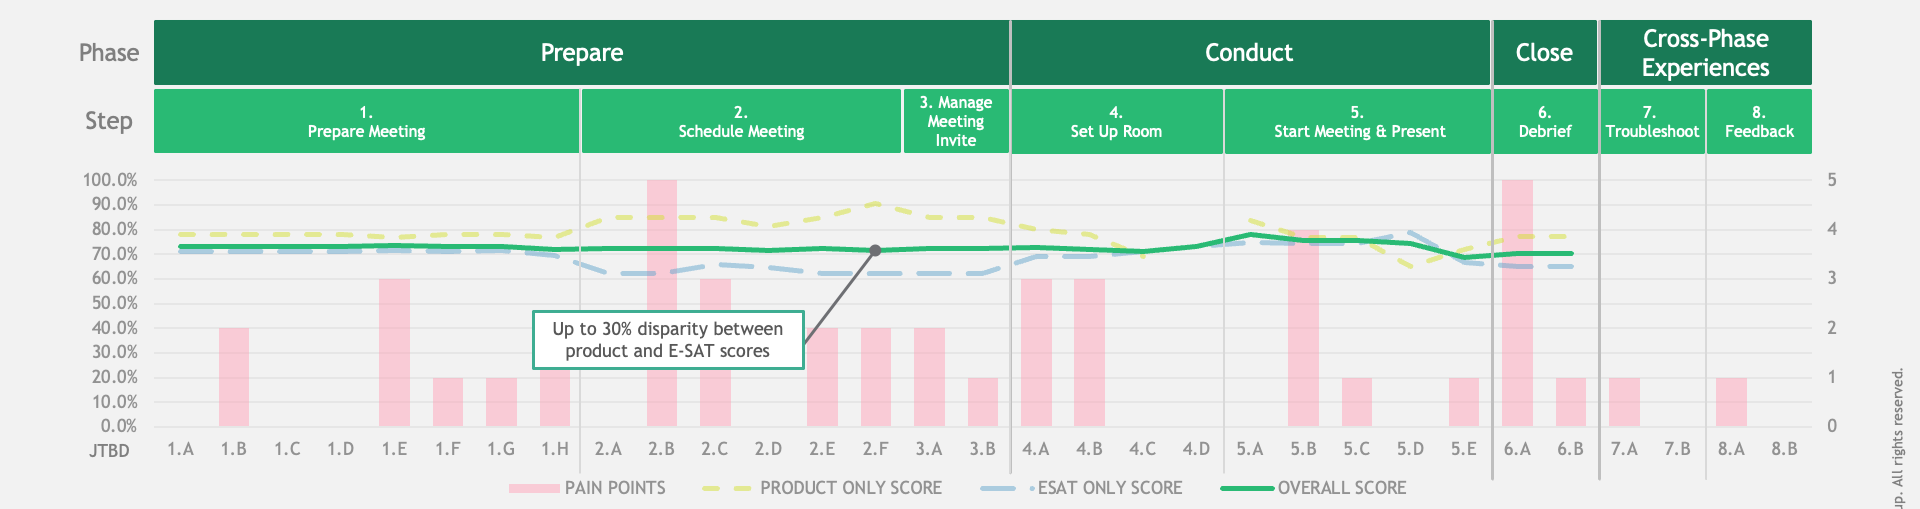
…by overlaying pain points and key performance indicators, we see the whole journey and gain insight at each key moment
Challenges
Averaged product metrics are not tailored to specific journey moments
Opportunities
How might we…insure that we capture user metrics and quantify them to present the holistic experience?
4. Design more than just the software; focus on systems, culture, policies and artifacts
5. Make it engaging and digestible
Key Learnings
- Journey mapping takes time — and needs strong stakeholder buy-in to succeed.
- Future-state thinking is tricky — guide product teams gently into thinking 1 year ahead.
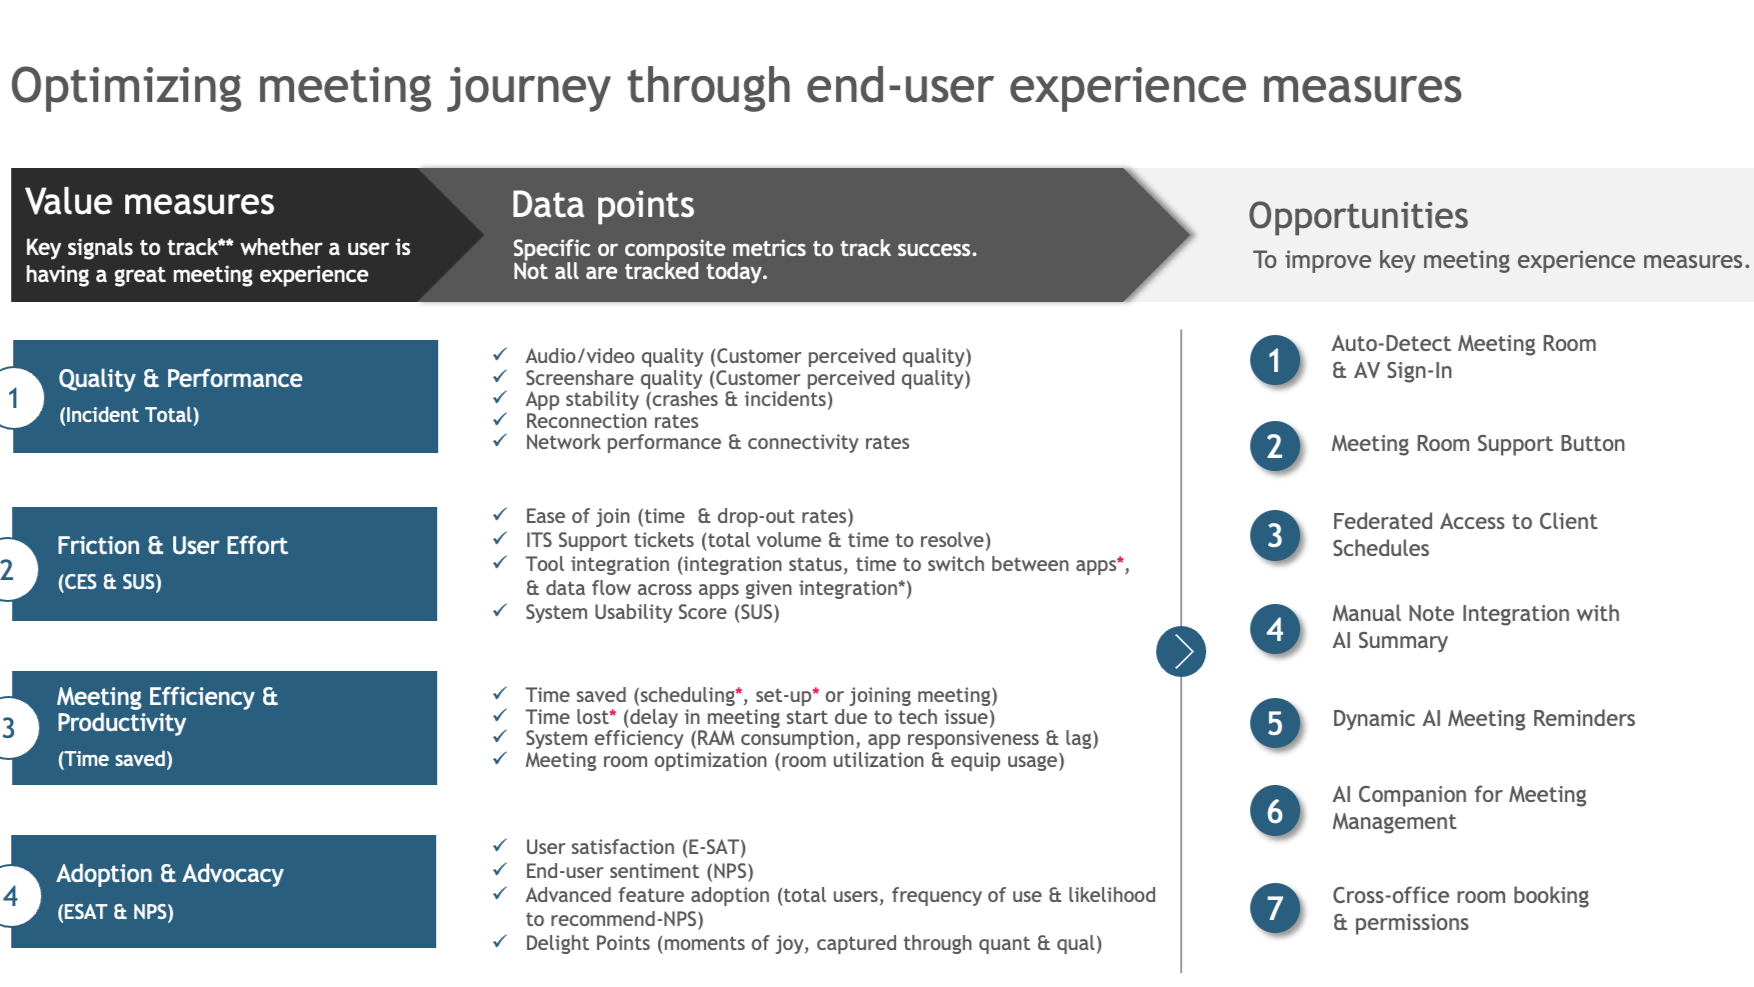
- Most teams already had solid metrics — very few needed to be created from scratch.
- System-level visibility was the biggest win — it helped teams see and communicate dependencies across products.